Fractals
1
I am doing fractals next because that is how we usually see non-linear systems. Fractal is a name coined by a fellow by the name of Mandelbrot in the 1960's. Fractals are the branch of geometry dealing with 'broken curves'. Remember that non-linear problems have graphs that have strange and unusual lines or ... 'broken curves'. There are two approaches to fractals: the natural lines (Has anyone ever seen a truly straight line or perfect curve in any natural object?) and the theoretical mathematical constructions. I will start with the lines occurring in nature since everyone here should be familiar with them and finally work our way into the mathematical curves.
2
An object in nature repeats itself. Consider a mountain. A peak on the shoulder of the mountain looks very much the same as the mountain. In fact a rock can be mistaken for a mountain if there is nothing next to it to show its size. A branch of a tree is a miniature of the tree. Some leaves are miniatures of branches. Each tributary of a river is a repetition of the whole river at a smaller scale. This repetition of structure with a change of scale is a characteristic of fractals.
If you seem to have any trouble understanding this idea of repetition of structure across scale, rent an old Godzilla movie from the video store. The effect is crude, but the repetition of structure between a branch and a tree, or hill and a mountain can easily be seen. You can also see another feature of natural curves. Although the imaging of structure across scale is very close to being a direct duplication it isn't exact. Waves in a bathtub are not quite the waves in an ocean, although they are very close.
NASA and movie studios use this idea of repetitive structure and change of scale to help generate life like pictures with data that is limited. Why the limited data? Look at a television screen, a magazine picture, etc. If you look closely you will see very small dots or dashes making up the picture. A single picture could be made up of thousands or millions of dots. Each dot could be made up of hundreds, possibly thousands of shades of color. That means for every individual picture you could have a few million single bits of information used to construct it. A computer does have storage capabilities in the millions, but with motion pictures using over twenty individual pictures per second and sound requiring close to the same storage requirements a motion picture being played through a computer would require billions upon billions of bits of storage. All of these bits of information would have to feed through the computer at the rate of a few billion bits per second. That is why it took the company, Pixar, 117 computer workstations and two and a half years to make the computer generated 77 minute movie 'Toy Story' for Disney. Sure we have used pictures and musical reproductions for years, but we are now insisting on closer to real life reproduction and that requires digital storage and reproduction. Godzilla versus Jurassic Park.
Instead of storing or reproducing an exact dot by dot image of an object, the pattern of how a larger object like a mountain is made up of peaks and rocks that are repetitions of each other is stored. The result is that a picture that would have taken millions of bits of information can now be stored as a pattern taking only a few thousand bits. And the result is easier to use and more life like. But this is not the truly important thing about fractals. The realization that a larger thing is made up of copies of itself at a smaller scale or visa versa is the important idea.
3
Now that we have a taste of how fractals or real life objects are repetitions of similar patterns across the scale of size, let's examine a more unusual characteristic of a fractal, the relationship of the outside boundary of an object with its interior. Why you ask? This relationship is different then what you would first expect, and the relationship has just as unexpected consequences.
Let's start with a thought game. Pretend that we have an island of which you are interested in discovering the length of the coastline and area. You start by renting an airplane and flying around the island. You get 20.2 miles around the island and an area of 60.3 square miles of land.
You then rent a jeep and drive around the island and again make detailed measurements. You get 22.1 miles around and an area of 59.5 square miles.
This time you walk the coastline. You get the results 25.03 miles and 60.32 squares miles.
A friend of yours has a trained mouse. You attach a radio collar to the animal and release him on the coast of the island. The measurements you get this time are 28.0547 miles and 60.2548 square miles.
What is happening? The coastline of the island keeps on increasing while the area of the island is staying the same. It turns out that the distance around a naturally occurring fractal curve is totally dependent on the scale used for measuring it. It will actually become infinitely large if you could find an infinitely small creature to measure it. Notice though that the area seems the same for each measurement.
If you are having trouble visualizing what is happening to the area, draw a rectangle on a piece of paper. Draw a diagonal from the top left corner to the lower right corner. Each half of the rectangle has exactly half the area of the original rectangle. Now using the diagonal as a guide bend the lower half of the diagonal to the lower left corner. Do the same with the upper half of the diagonal, but bend it to the upper right corner by the same amount. Look carefully. The new 'broken' diagonal still divides the rectangle into two pieces that are still exactly half the area of the original rectangle. Anything that was lost in area by the 'broken' line's peak was gained by the valley farther along the line. 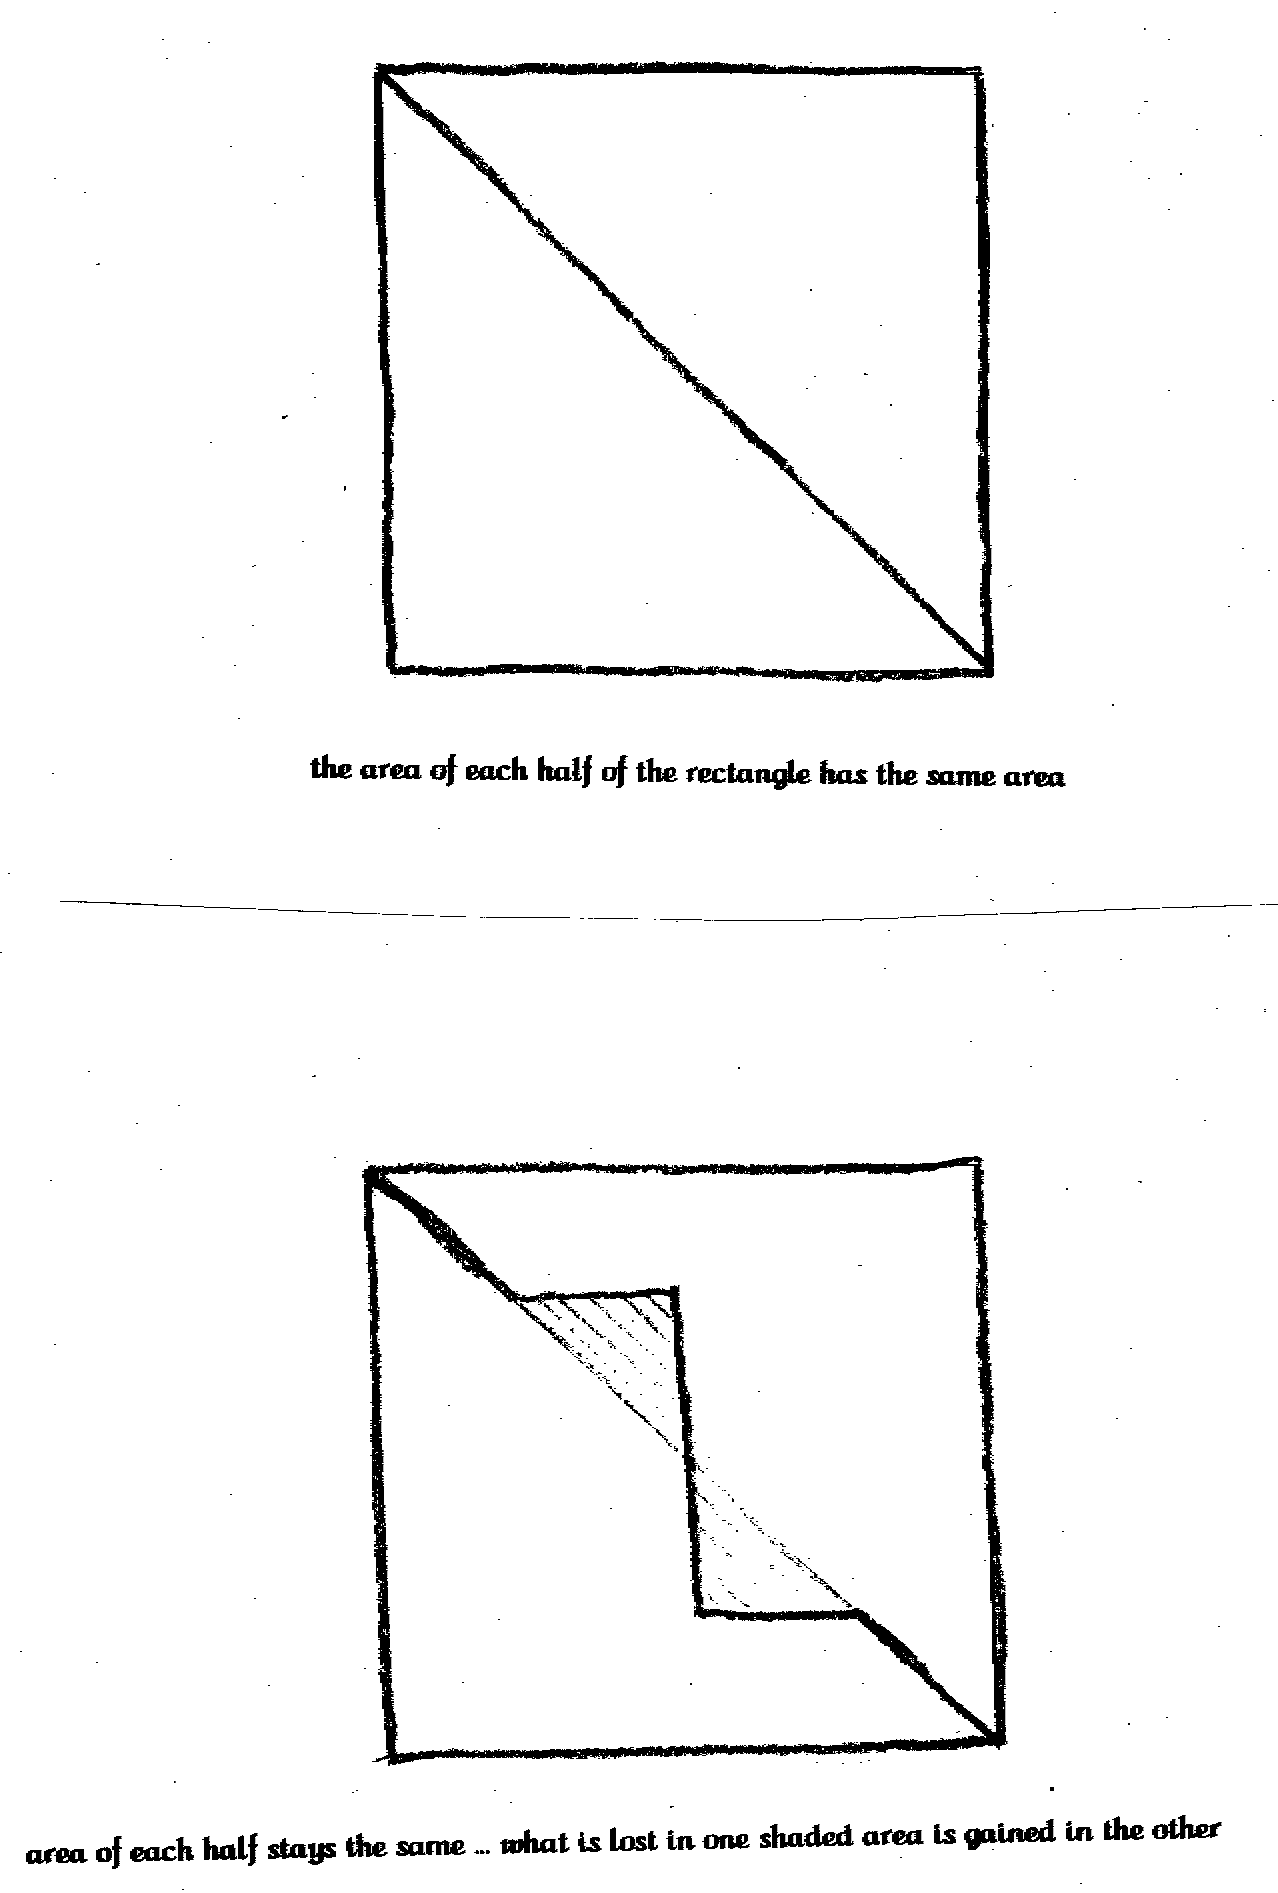
So a natural closed fractal has infinite circumference and a finite area. This might not seem very important now but if you decide to work with fractals this idea becomes very important and it is totally different then what most of you have learned in school. In school everything had finite circumferences and areas. This has a real life consequence that anyone reading this, can check out. Find two atlases. Each has to be made using a different measurement scale. The easiest way to find an atlas with a different measurement system is to find one from a country that uses a metric system and another from one that uses English miles. Now look up the distance for a river or a border in each atlas. They are different. They have to be, different measuring scales were used. Why? Each atlas is trying to measure an infinitely complex curve with a different finite or set measurement scale. Each measurement scale approximates the infinite curve differently. The results can vary by hundreds of miles depending on which scales and countries are being compared.
4
Let's start our look at the theoretical fractal curves with the best known, the Mandelbrot curve.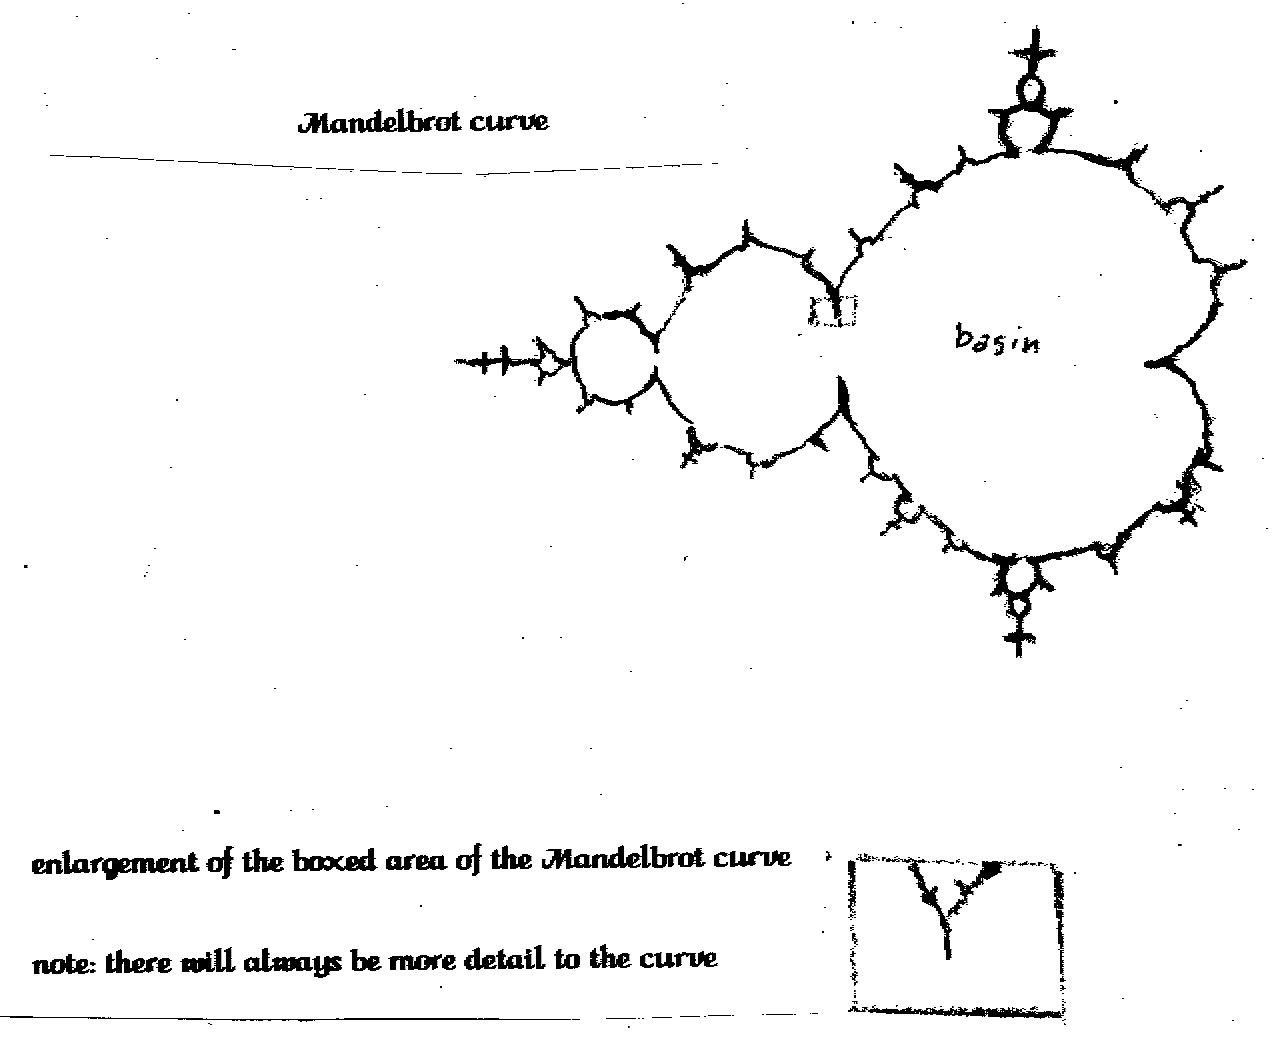 It has been called the most complicated curve in the world. Mathematicians have spent decades just examining portions of this curve. If you haven't already guessed we are just going to glance at the curve. Personally I am not interested in it enough to spend a few decades exploring the curves features. The curve is very easy to generate. You start with the equation Zn+1=Zn2+C. C is a complex number representing the location of a dot on the computer screen. (If you are unfamiliar with complex numbers, don't worry about it now. All you need to know, at this time, is that complex numbers make it easy to map out a point on a flat plane such as a computer screen and that they are periodic. Since they are periodic they can be used to mimic periodic real life systems, changing seasons, day and night, static on the phone line.) You start calculating the equation with the first Zn as zero(the origin). The subscripts n and n+1 tell you the order you use the variable Z. The Z with the subscript n+1 is used as Zn the next time you calculate the equation. You iterate or calculate the equation again and again. If the equation keeps generating larger and larger numbers the dot on the computer screen is outside the Mandelbrot curve. If the number stays within a circle with a radius of 2 to the starting point, it is inside the curve. That's it. The curve is just the border between the set of numbers that stay close to their starting point and the set that speeds away. That monstrously complex curve is just that simple equation.
We have just discovered the main idea of fractals. Very complex curves can be made by simple equations. You might be wondering why it took so long for mathematicians to discover this fact. Let's look again at what was done. First there are over 10,000 dots on a standard computer screen. Each dot would require the calculation of the equation. Now remember that the equation was iterated or calculated more then once for each dot. In fact the usual number of times the equation is iterated is about a 100 times. So in order to generate the Mandelbrot curve we had to calculate the same simple equation over a million times. Before the advent of cheap easy access to computers starting in the1960's no one had time to work out the equations. Would you do it using just a paper and pencil?
Fractals of other types were being done a hundred years ago, but more about that later. Let's look a little more closely at the Mandelbrot set.
5
There are many ways to study how broken a curve is. From high school geometry we should remember a few things about dimension. A point has no dimension or size. A point is just a location. A straight line has just one dimension, length. The inside of a square has two dimension, length and width. A cube has three, length, width, and depth. And so on.
If you look at the line generated by the Mandelbrot set you will see that it doubles back and forth on itself. The increase in dimension by this doubling back has been calculated as giving the curve a dimension of two. In other words the straight line has been 'broken' enough so it starts to take up space and turns into a two dimensional object! Remember, we are talking about a line becoming a two dimensional object. You have got to separate the line from the space inside. The basin inside the Mandelbrot set is not part of the curve just as the one dimensional lines making a rectangle are not part of the two dimensional area inside the rectangle.
How broken something is, or its dimension, can be used to classify Fractals. The dimension of a civilization's art tells the age of the civilization. A hunter gatherer type nomadic society doesn't have straight lines. Nature doesn't produce straight lines. A nomadic society's art, therefore has very broken lines or a dimension much larger then one. A society that has been around for years produces objects with straight lines and standard measures. Walls, doors, windows have straight lines because a straight line is easy to reproduce. You can have many people working on a building, because each person would be reproducing 'straight' objects, etc. So an older society will have art that has a dimension closer to the dimension of one.
Fractal dimension has been used to analyze more that just the age of a society by its art. It's been used in medicine to help doctors decide if an Xray shows a cancer or a benign growth, in geology to determine the chance of an earthquake occurring, in biology which species a tree belongs to...
6
Mathematicians have been using fractals for about one hundred years, of course they didn't call them fractals or understand completely what they had accomplished. The commonly called 'classical' fractals that are still used today go by many interesting names, Cantor sets, Sierpinski's gaskets, Koch curves, Hilbert curves, etc. They are all constructed using easy rules. 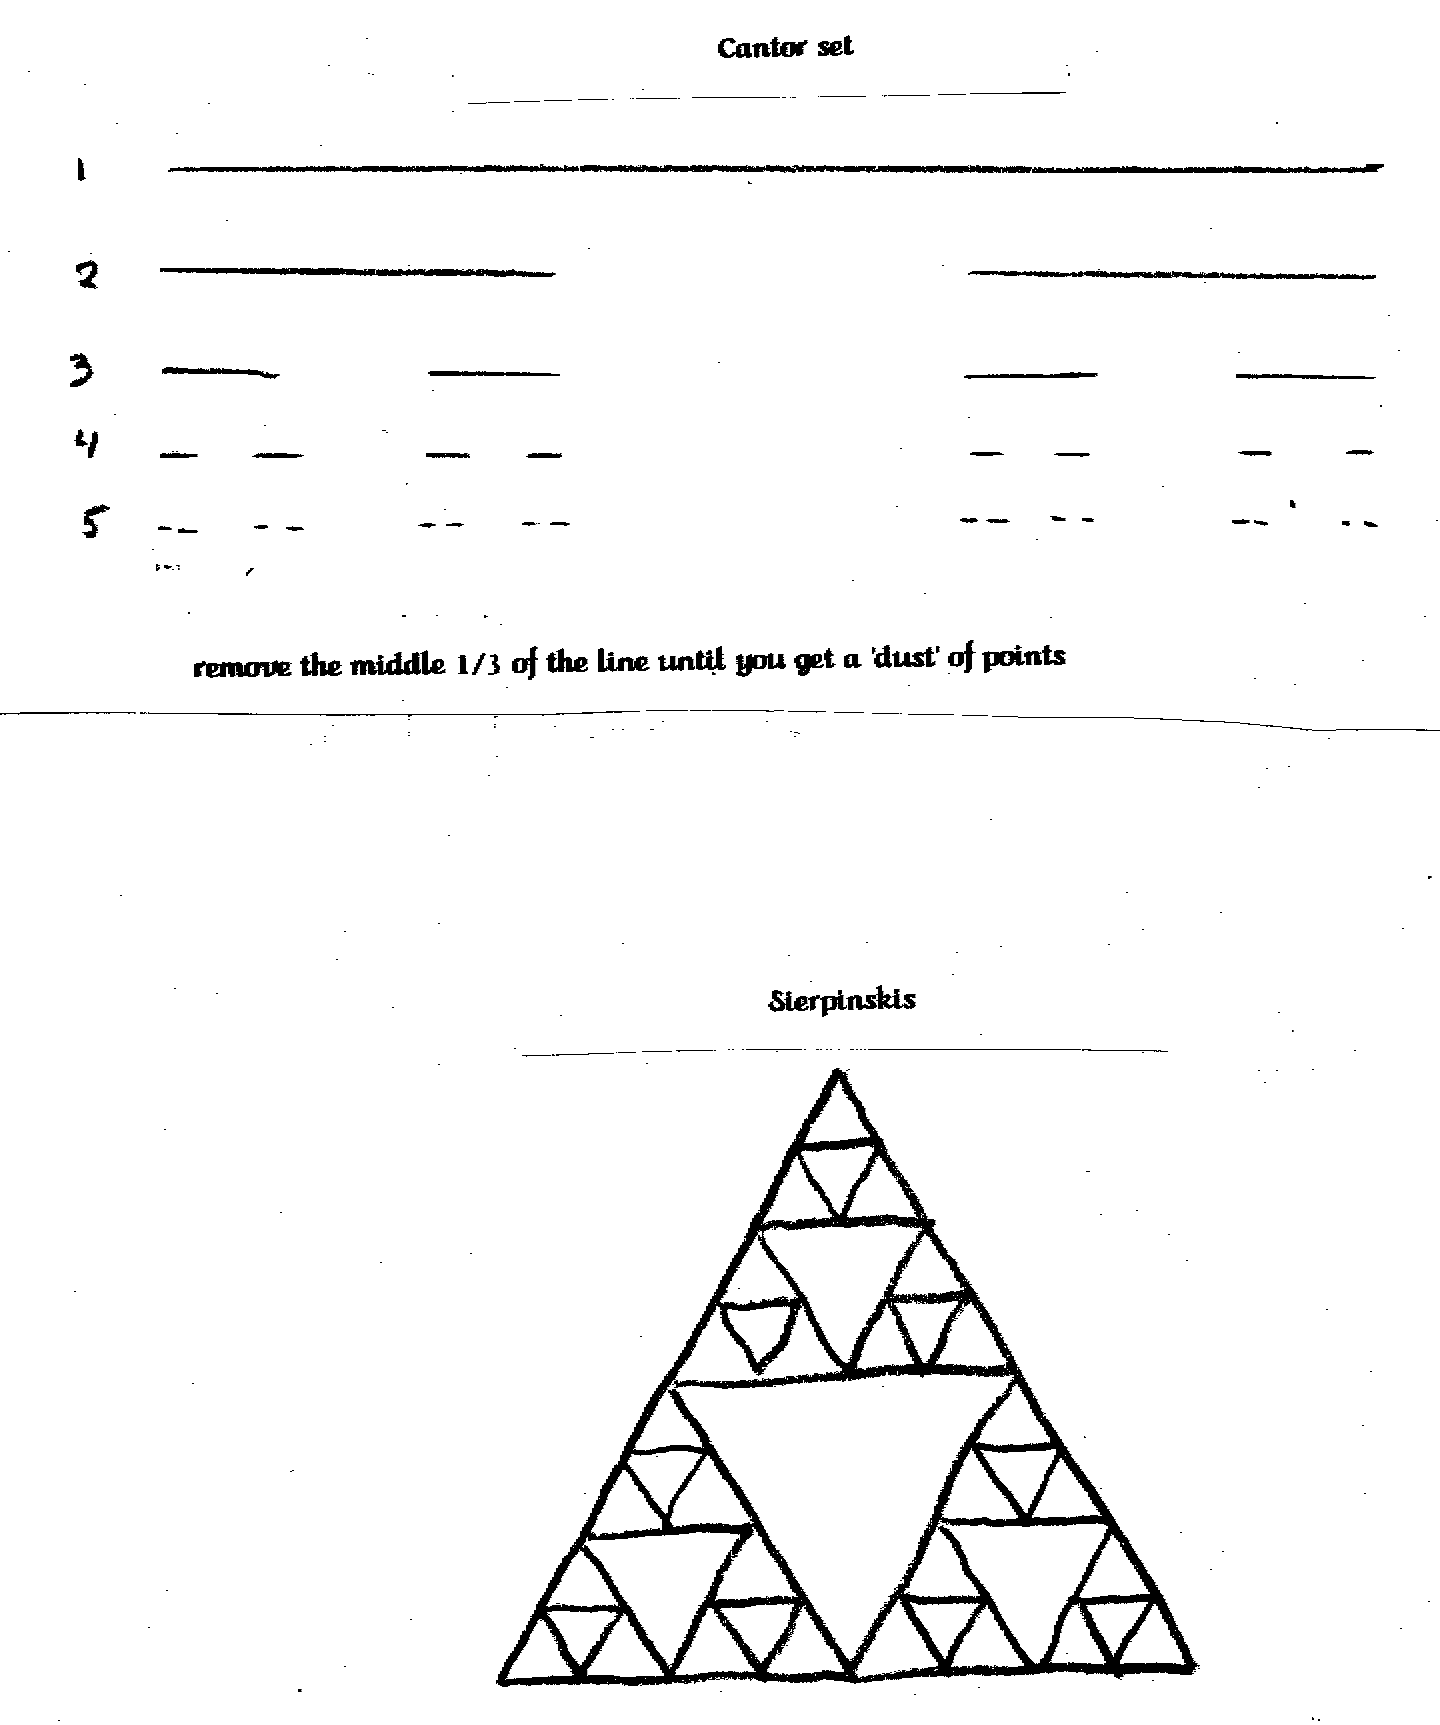
The Cantor set is just a line segment that has the middle third of itself removed. After which every resulting segment has its middle third removed, and so on. It is the same as the iteration we talked about with the Mandelbrot set. (If you have studied about computers or engineering you might be more comfortable with the term recursion instead of iteration.) You are left with a 'dusting' of points. It doesn't sound like much of an object, in fact it doesn't seem to have a dimension, but Cantor used it to demonstrate a weakness with the rules being used in calculus.
Sierpinski's gasket is just a triangle with another triangle cut out of its insides. Again this is done over and over again. The result is a fine latticework of triangles that always have triangular holes but that takes up enough space to become more than a one-dimensional object.
These strange fractals seem to have no purpose other than showing exceptions to commonly accepted mathematical rules. The interesting thing about them is that they seem to turn up where they are not expected. Pascal's triangle can be used to create Sierpinski's gasket. The Koch's curve can sometimes be seen in frost patterns. The Cantor set shows up when you are studying a doubling function. They seem to be representations of some underlying mathematical or real life concepts, otherwise you shouldn't be able to find them in so many places. (Feedback, rules, and similar patterns strike again!)
Summary
Fractals show the infinitely fine detail of non-linear problems, their similarity across scale, and the repetitive nature of their construction. It also bares to review the idea that many non-linear problems can be reduce to a very simple equation that is solved over and over again, each time using the result of the previous solution for the current iteration or recursion. These intermediate solutions to the non-linear problems will be referred to many times in the following sections. There is much more that could be said about fractals. But it is time to go on.
back to the intro next section chaos
Back to the Keep's Gate